Given what you already know about protein structure, it should be easy to figure how to inhibit an enzyme.
Since structure mediates function, anything that would significantly change the structure of an enzyme would inhibit the activity
of the enzyme. Hence extremes of pH and high temperature, all of which can denature the enzyme, would inhibit the enzyme in
a irreversible fashion, unless it could refold properly. Alternatively we could add a small molecule which interacts noncovalently
with the enzyme to either change its conformation or directly prevent substrate binding. Finally, we could covalently modify
certain side chains, that if they are essential to enzymatic activity, would irreversibly inhibit the enzyme.
COVALENT INHIBITION
We discussed previously the types of reagents that would chemically modify specific side chains that might
be critical for enzymatic activity. For example, iodoacetamide might abolish enzyme activity if a Cys side chain is required
for activity. These reagents will usually modify several side chains, however, and determining which is critical for binding
or catalytic conversion of the substrate can be difficult. One way would be to protect the active site with a saturating quantities
of a ligand which binds reversibly at the active site. Then the chemical modification can be performed at varying reaction
times. The critical side chain would be protected from the chemical modification, but the extent of protection would depend
on the Kd, concentration of the protecting ligand., and the length of the reaction.
TYPES OF NONCOVALENT INHIBITION
A. COMPETITIVE
 Competitive inhibition occurs when substrate (S) and inhibitor (I) both bind to the same site on the enzyme. In effect, they
compete for the active site and bind in a mutually exclusive fashion. This is illustrated in the mechanism at the top of the
figure to the left, and in the molecular cartoon beneath it. There is another type of inhibition that would give the same
kinetic data. If S and I bound to different sites, and S bound to E and produced a conformational change in E such that
I could not bind (and vice versa), then the binding of S and I would be mutually exclusive. This is called allosteric competitive
inhibition. Inhibition studies are usually done at several fixed and non-saturating concentrations of I and varying S concentrations.
The key kinetic parameters to understand are Vm and Km. Let us assume for ease of equation derivation that I binds reversibly,
and with rapid equilibrium to E, with a dissociation constant Kis. A look at the top mechanism shows that even
in the presence of I, as S increases to infinity, all E is converted to ES. That is, there is no free E to which I could bind.
Now remember that Vm= kcatEo. Under these condition, ES = Eo; hence v = Vm. Vm
is not changed. However, the apparent Km, Kmapp, will change. We can use LaChatelier's principle to understand
this. If I binds to E alone, and not ES, it will shift the equilibrium of E + S <==> ES to the left, which would have
the affect of increasing the Km app (i.e. it would appear that the affinity of E and S has decreased.). The double
reciprocal plot (Lineweaver Burk plot) offers a great way to visualize the inhibition. In the presence of I, Vm does not change,
but Km appears to increase. Therefore, 1/Km, the x-intercept on the plot will get smaller, and closer to 0. Therefore the
plots will consists of a series of lines, with the same y intercept (1/Vm), and the x intecepts (-1/Km) closer and closer
to the 0 as I increases. These intersecting plots are the hallmark of competitive inhibition.
An equation, shown in the diagram above, can be derived which shows the effect of the competitive inhibitor
on the velocity of the reaction. The only change is that the Km term is multiplied by the factor 1+I/Kis. Hence Kmapp
= Km(1+I/Kis). This shows that the apparent Km does increase as we predicted. Kis is the inhibitor dissociation constant
in which the inhibitor affects the slope of the double reciprocal plot.
 Java Applet: Competitive Inhibition I; Competitive Inhibition II
B. UNCOMPETITIVE
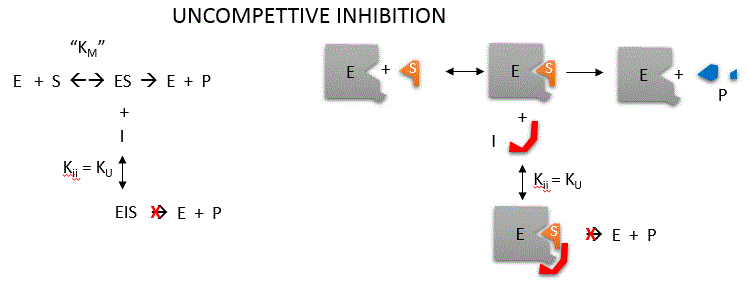
 Uncompetitive inhibition occurs when I binds only to ES and not free E. One can hypothesize that on binding S, a conformational
change in E occurs which presents a binding site for I. Inhibition occurs since ESI can not form product. It
is a dead end complex which has only one fate, to return to ES. This is illustrated in the mechanism at the top of the figure
to the left, and in the molecular cartoon beneath it. Let us assume for ease of equation derivation that I binds reversibly
to ES with a dissociation constant Kii. A look at the top mechanism shows that in the presence of I, as S increases
to infinity, not all of E is converted to ES. That is, there is a finite amount of ESI, even at infinite S. Now remember that
Vm = kcatEo if and only if all E is in the form ES . Under these conditions, the apparent
Vm, Vmapp is less than the real Vm without inhibitor. In addition, the apparent Km, Kmapp, will change.
We can use LaChatelier's principle to understand this. If I binds to ES alone, and not E, it will shift the equilibrium of
E + S <==> ES to the right , which would have the affect of decreasing the Kmapp (i.e. it would appear that
the affinity of E and S has increased.). The double reciprocal plot (Lineweaver Burk plot) offers a great way to visualize
the inhibition. In the presence of I, both Vm and Km decrease. Therefore, -1/Km, the x-intercept on the plot, will get more
negative, and 1/Vm will get more positive. It turns out that they change to the same extent. Therefore the plots will consist
of a series of parallel lines, which is the hallmark of uncompetitive inhibition.
(note: the first mathematical equation in the left box should read Kii)
An equation, shown
in the diagram above, can be derived which shows the effect of the uncompetitive inhibitor on the velocity of the reaction.
The only change is that the S term in the denominator is multiplied by the factor 1+I/Kii. We would like to rearrange this
equation to show how Km and Vm are affected by the inhibitor, not S, which obviously isn't. Rearranging the equation as shown
above shows that Kmapp = Km/(1+I/Kii) and Vmapp = Vm/(1+I/Kii). This shows that the apparent
Km and Vm do decrease as we predicted. Kii is the inhibitor dissociation constant in which the inhibitor affects
the intercept of the double reciprocal plot. Note that if I is zero, Km and Vm are unchanged.
 Java Applet: Uncompetitive Inhibition
C. NONCOMPETITIVE
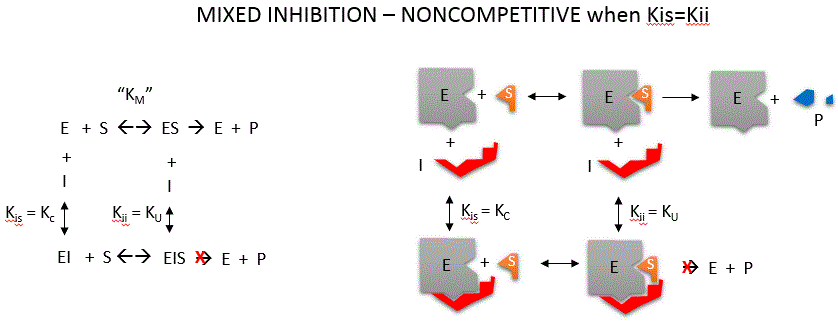
 Noncompetitive inhibition occurs when I binds to both E and ES. We will look at only the special case in which the dissociation
constants of I for E and ES are the same. This is called noncompetiive inhibition. In the more general case, the Kd's are
different, and the inhibition is called mixed. Since inhibition occurs, we will hypothesize that ESI can not
form product. It is a dead end complex which has only one fate, to return to ES or EI. This is illustrated in the mechanism
at the top of the figure to the left, and in the molecular cartoon beneath it. Let us assume for ease of equation derivation
that I binds reversibly to E with a dissociation constant of Kis (as we denoted for competitive inhibition) and
to ES with a dissociation constant Kii (as we noted for uncompetitive inhibition). Assume for noncompetitive inhibition
that Kis = Kii. A look at the top mechanism shows that in the presence of I, as S increases to infinity, not all of E is converted
to ES. That is, there is a finite amount of ESI, even at infinite S. Now remember that Vm = kcatEo if
and only if all E is in the form ES . Under these conditions, the apparent Vm, Vmapp is less than the
real Vm without inhibitor. In contrast, the apparent Km, Kmapp, will not change since I binds to both E and
ES with the same affinity, and hence will not perturb that equilibrium, as deduced from LaChatelier's principle. The double
reciprocal plot (Lineweaver Burk plot) offers a great way to visualize the inhibition. In the presence of I, just Vm will
decrease. Therefore, -1/Km, the x-intercept will stay the same, and 1/Vm will get more positive. Therefore the plots will
consists of a series of lines intersecting on the x axis, which is the hallmark of noncompetitive inhibition. You should be
able to figure out how the plots would appear if Kis is different from Kii (mixed inhibition).
An equation,
shown in the diagram above can be derived which shows the effect of the uncompetitive inhibitor on the velocity of the reaction.
In the denominator, Km is multiplied by 1+I/Kis, and S by 1+I/Kii. We would like to rearrange this equation to show how Km
and Vm are affected by the inhibitor, not S, which obviously isn't. Rearranging the equation as shown above shows that Kmapp
= Km(1+I/Kis)/(1+I/Kii) = Km when Kis=Kii, and Vmapp = Vm/(1+I/Kii). This shows that the Km is unchanged
and Vm decreases as we predicted. The plot shows a series of lines intersecting on the x axis. Both the slope and the y intercept
are changed, which are reflected in the names of the two dissociation constants, Kis and Kii. Note that if I
is zero, Kmapp = Km and Vmapp = Vm.
 Java Applet: Noncompetitive Inhibition
If you can apply LeChatilier's principle, you should be able to draw the Lineweaver-Burk plots for any
scenario of inhibition or even the opposite case, enzyme activation!
INHIBITION BY TEMPERATURE CHANGE
From 0 to about 40-50o C, enzyme activity usually increases, as do the rates of most reactions
in the absence of catalysts. (Remember the general rule of thumb that reaction velocities double for each increase of 10oC.).
At higher temperatures, the activity decreases dramatically as the enzyme denatures.
Figure: Temperature and Enzyme Activity

INHIBITION BY PH CHANGE
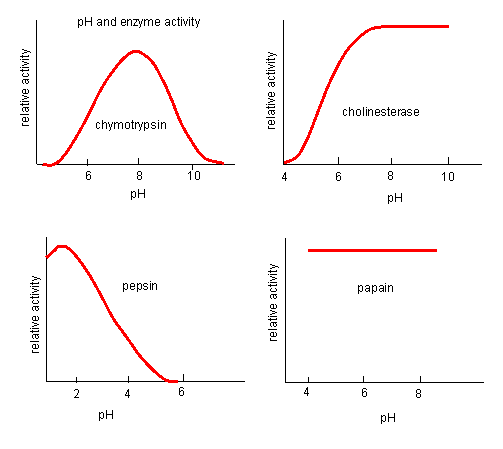
pH has a marked effect on the velocity of enzyme-catalyzed reactions.
Figure: pH and Enzyme Activity

Think of all the things that pH changes might affect. It might
- affect E in ways to alter the binding of S to E, which would affect Km
- affect E in ways to alter the actual catalysis of bound S, which would affect kcat
- affect E by globally changing the conformation of the protein
- affect S by altering the protonation state of the substrate
The easiest assumption is that certain side chains necessary for catalysis must be in the correct protonation
state. Thus, some side chain, with an apparent pKa of around 6, must be deprotonated for optimal activity of trypsin which
shows an increase in activity with the increase centered at pH 6. Which amino acid side chain would be a likely candidate?
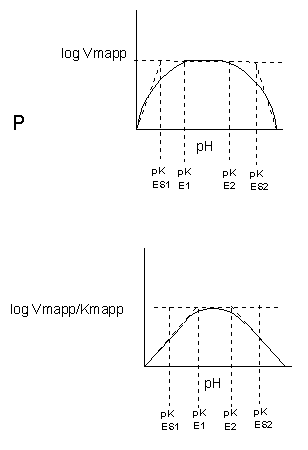
See the following figure which shows how pH effects on enzyme kinetics can be modeled at the chemical
and mathematical level.
Figure: Chemical equations showing the mechanism of pH effects on enzyme catalyzed reactions

Figure: Mathematic equations modeling pH effects on enzyme catalyzed reactions

Figure: Graphs of pH effects on enzyme catalyzed reactions


